2010年2月27日智利8.8級地震震源破裂過程初步結(jié)果
Preliminary result for Rupture Process of Feb. 27, 2010, M 8.8, Earthquake,Chile
王衛(wèi)民1 趙連鋒2 姚振興2
1中國科學(xué)院青藏高原研究所,北京,100085
2中國科學(xué)院地質(zhì)與地球物理研究所,北京,100029
地震發(fā)生后,從IRIS數(shù)據(jù)中心下載了地震數(shù)據(jù)資料用于研究地震震源機(jī)制和震源破裂過程。選取其中信噪比較高并且沿方位角分布比較均勻的26個遠(yuǎn)場P波波形(震中距位于30度之90度范圍之內(nèi))和8個震中距較近的P波初動資料進(jìn)行點(diǎn)源模型的波形反演;根據(jù)反演結(jié)果再利用26個遠(yuǎn)場P波波形并增加20個SH波波形資料用于震源過程反演。初始破裂點(diǎn)取USGS給出的震中位置。
計算得到的地震矩為1.1×10²²Nm,Mw=8.6。最大滑動800cm。
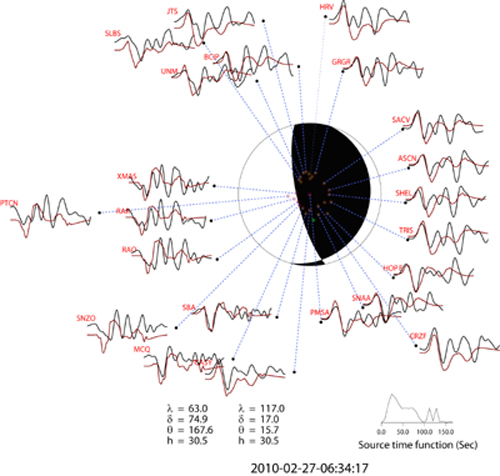
圖1 智利8.8級地震震源機(jī)制解
采用下半球投影,同時給出了點(diǎn)源模型的P波垂向位移理論圖(紅線)與資料(黑線)的擬合情況。“+”(綠)和“-”(蘭)的圓圈表示P波初動極性及投影位置,紅色圓圈表示用于波形反演的臺站的投影位置。圖形下方給出了兩組節(jié)面解(左下,λ,δ,θ,h分別表示錯動傾伏角、斷層傾角、斷層走向、震源深度)和點(diǎn)源模型的震源時間函數(shù)(右下)。
Figure 1 Focal mechanism of the M8.8 Chile earthquake.
Lower-hemisphere projection is used here. The observed P wave records (black line) and the synthetic seismogram (red line) based on the simple point model are compared. The green and blue circles with “+” and “-“ indicate the polarity of the direct P wave, and the red circles are the projection of the stations. The parameters of two possible fault planes are listed also, withl,d,q,h indicating the rake angle, dip angle, strike direction and source depth respectively. The obtained source time function are plotted.
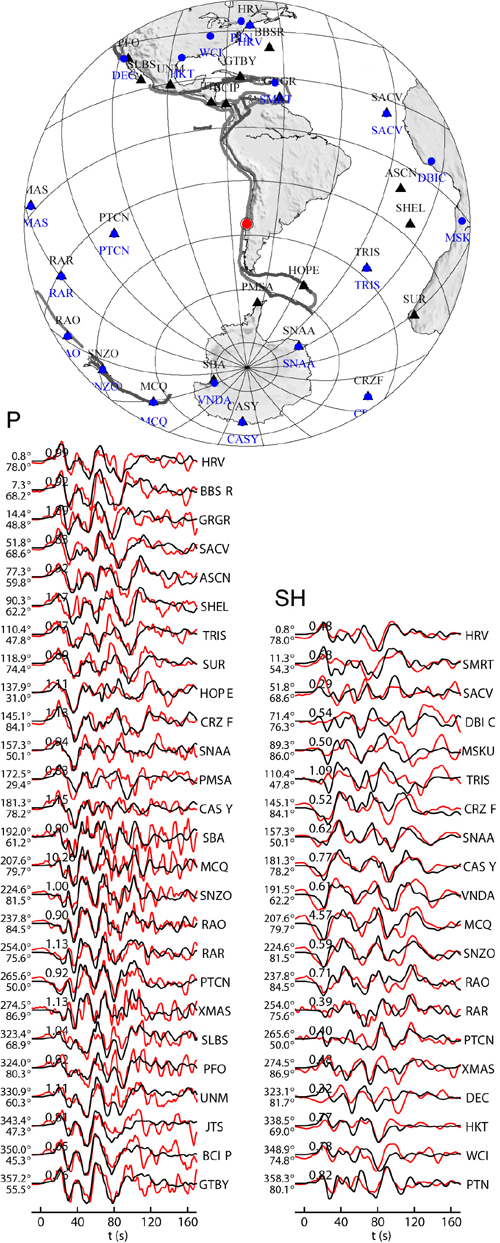
圖2 有限斷層模型的遠(yuǎn)場P和SH波形擬合
上圖為臺站分布,其中黑色三角為選用P波記錄的臺站,藍(lán)色圓為選用SH波記錄的臺站。
下圖左列為P波垂向位移理論圖(紅線)與記錄(黑線)的對比;右列為SH波切向位移理論圖(紅線)與記錄(黑線)的對比;并給出每個記錄的方位角(左上)、震中距(左下)、振幅比(上)和臺站名(右)。
Figure 2 Comparison of the observed teleseismic P and SH records with the synthetic waveforms.
The location of the stations (upper panel): the black triangles and blue circles represent the stations used for P wave and SH wave inversion respectively. Comparison of observed (black) and synthetic waveforms (red) for P vertical components, and SH components are shown in the lower panel, the azimuth, epicentral distance, amplitude ratio and station name are also indicated.
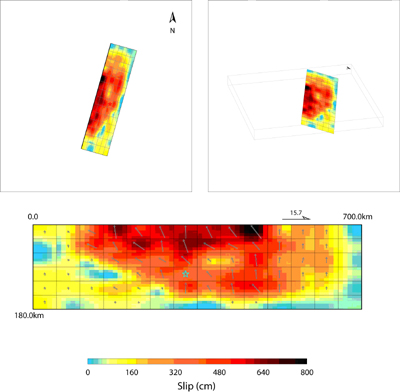
圖3 地震斷層面上滑動分布
圖中分別給出了有限斷層模型的地表投影(左上)和三維示意圖(右上)
Figure 3 Inverted slip distribution on the fault.
Surface projection of fault model ( up-left ) and 3D view of the fault model ( up-right ) are shown
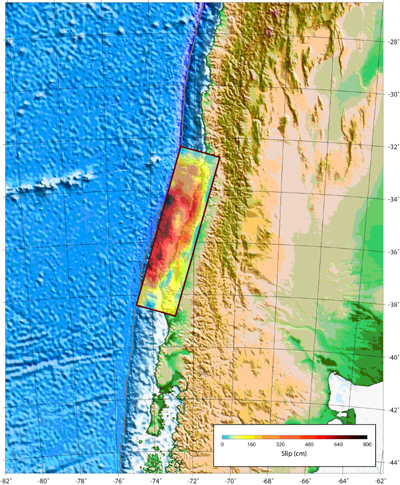
圖4 地震斷層滑動分布投影
Fig. 4 The map shows the projection of slip distribution on the ground
 微博
微博 微信
微信 震情
震情 地震科普
地震科普 返回頂部
返回頂部
 網(wǎng)站地圖